Where Data Centers Actually Build
Categories:
The premise
A company may say many things about the requirements of when, where, why, and how they build a data center. The full and true reasons of the company’s decisions lie in the site location they eventually chose.
The siting record is the requirements document.
Two definitions first. A data center is a facility housing computing equipment. The large data centers in this analysis are campus-scale facilities of 100 megawatts or more, owned or leased by companies like Amazon, Microsoft, Google, Meta, Apple, Oracle, and a few AI-specific entrants. This dataset covers twenty-five years of construction.
Water stress, as used in the datasets below, is the World Resources Institute’s measure of competition for local water supply, where “high” means most of the renewable supply is already spoken for.
The record, in four eras
I built a dataset of eighty-six major campuses to examine what the record reveals. The dataset covers announcement, construction, and first-operation dates, sourced one at a time, and the stated siting reason wherever an operator or a host jurisdiction gave one [7]. The era boundaries are derived from the data, marking shifts in where these facilities built and why. The year distribution is a continuous ramp with no natural gaps, a limit the dataset note addresses directly [7].
Era one, through 2009. Fiber and cheap power. Eleven campuses, spread thin across Northern Virginia, Georgia, the Carolinas, Oregon, Washington, Texas, Illinois, and Iowa. Loudoun County became the largest concentration on Earth because it hosted early internet exchange points where fiber routes converged, supported by Dominion Virginia Power’s cheap coal and nuclear baseload fleet operating within the PJM grid [10]. The reasons stated in this period are connectivity and power-cost.
Era two, 2010 to 2016. Cloud scale-out. Thirteen campuses, concentrated where power was the cheapest. Oregon, Iowa, and North Carolina each doubled their campus count. Central Washington offered Columbia River hydropower, the nation’s cheapest electricity. Google built at The Dalles and the industry followed. The power was clean, but more important was the price.
Era three, 2017 to 2021. Regional expansion. Twenty-one campuses. Virginia kept building: six more campuses layered onto the original cluster. The rest pushed into new ground: Texas, Arizona, Alabama, New Mexico, Nevada, Utah, Ohio, Georgia, Nebraska, and Tennessee. That new ground was not the cheapest grids, not the cleanest power, and not the wettest regions. What it offered was land, permissive siting, and speed of build. This is also the period in which the stated reason becomes “access to renewable energy,” repeated in near-identical language across operators. Because of that repetition, it is the least informative text in the dataset.
Era four, 2022 to now. The AI buildout. Forty-one campuses, some not yet energized. Texas still leads with seven, but the new weight is breadth: twenty-three states now host an era-four campus, most with just one or two, and no single region dominates the way earlier eras clustered. Virginia, the dominant state in every prior era, now has exactly one, a single Microsoft campus, the same as most of the others. Wisconsin has three: Mount Pleasant, Beaver Dam, and Port Washington, two of them still under construction.
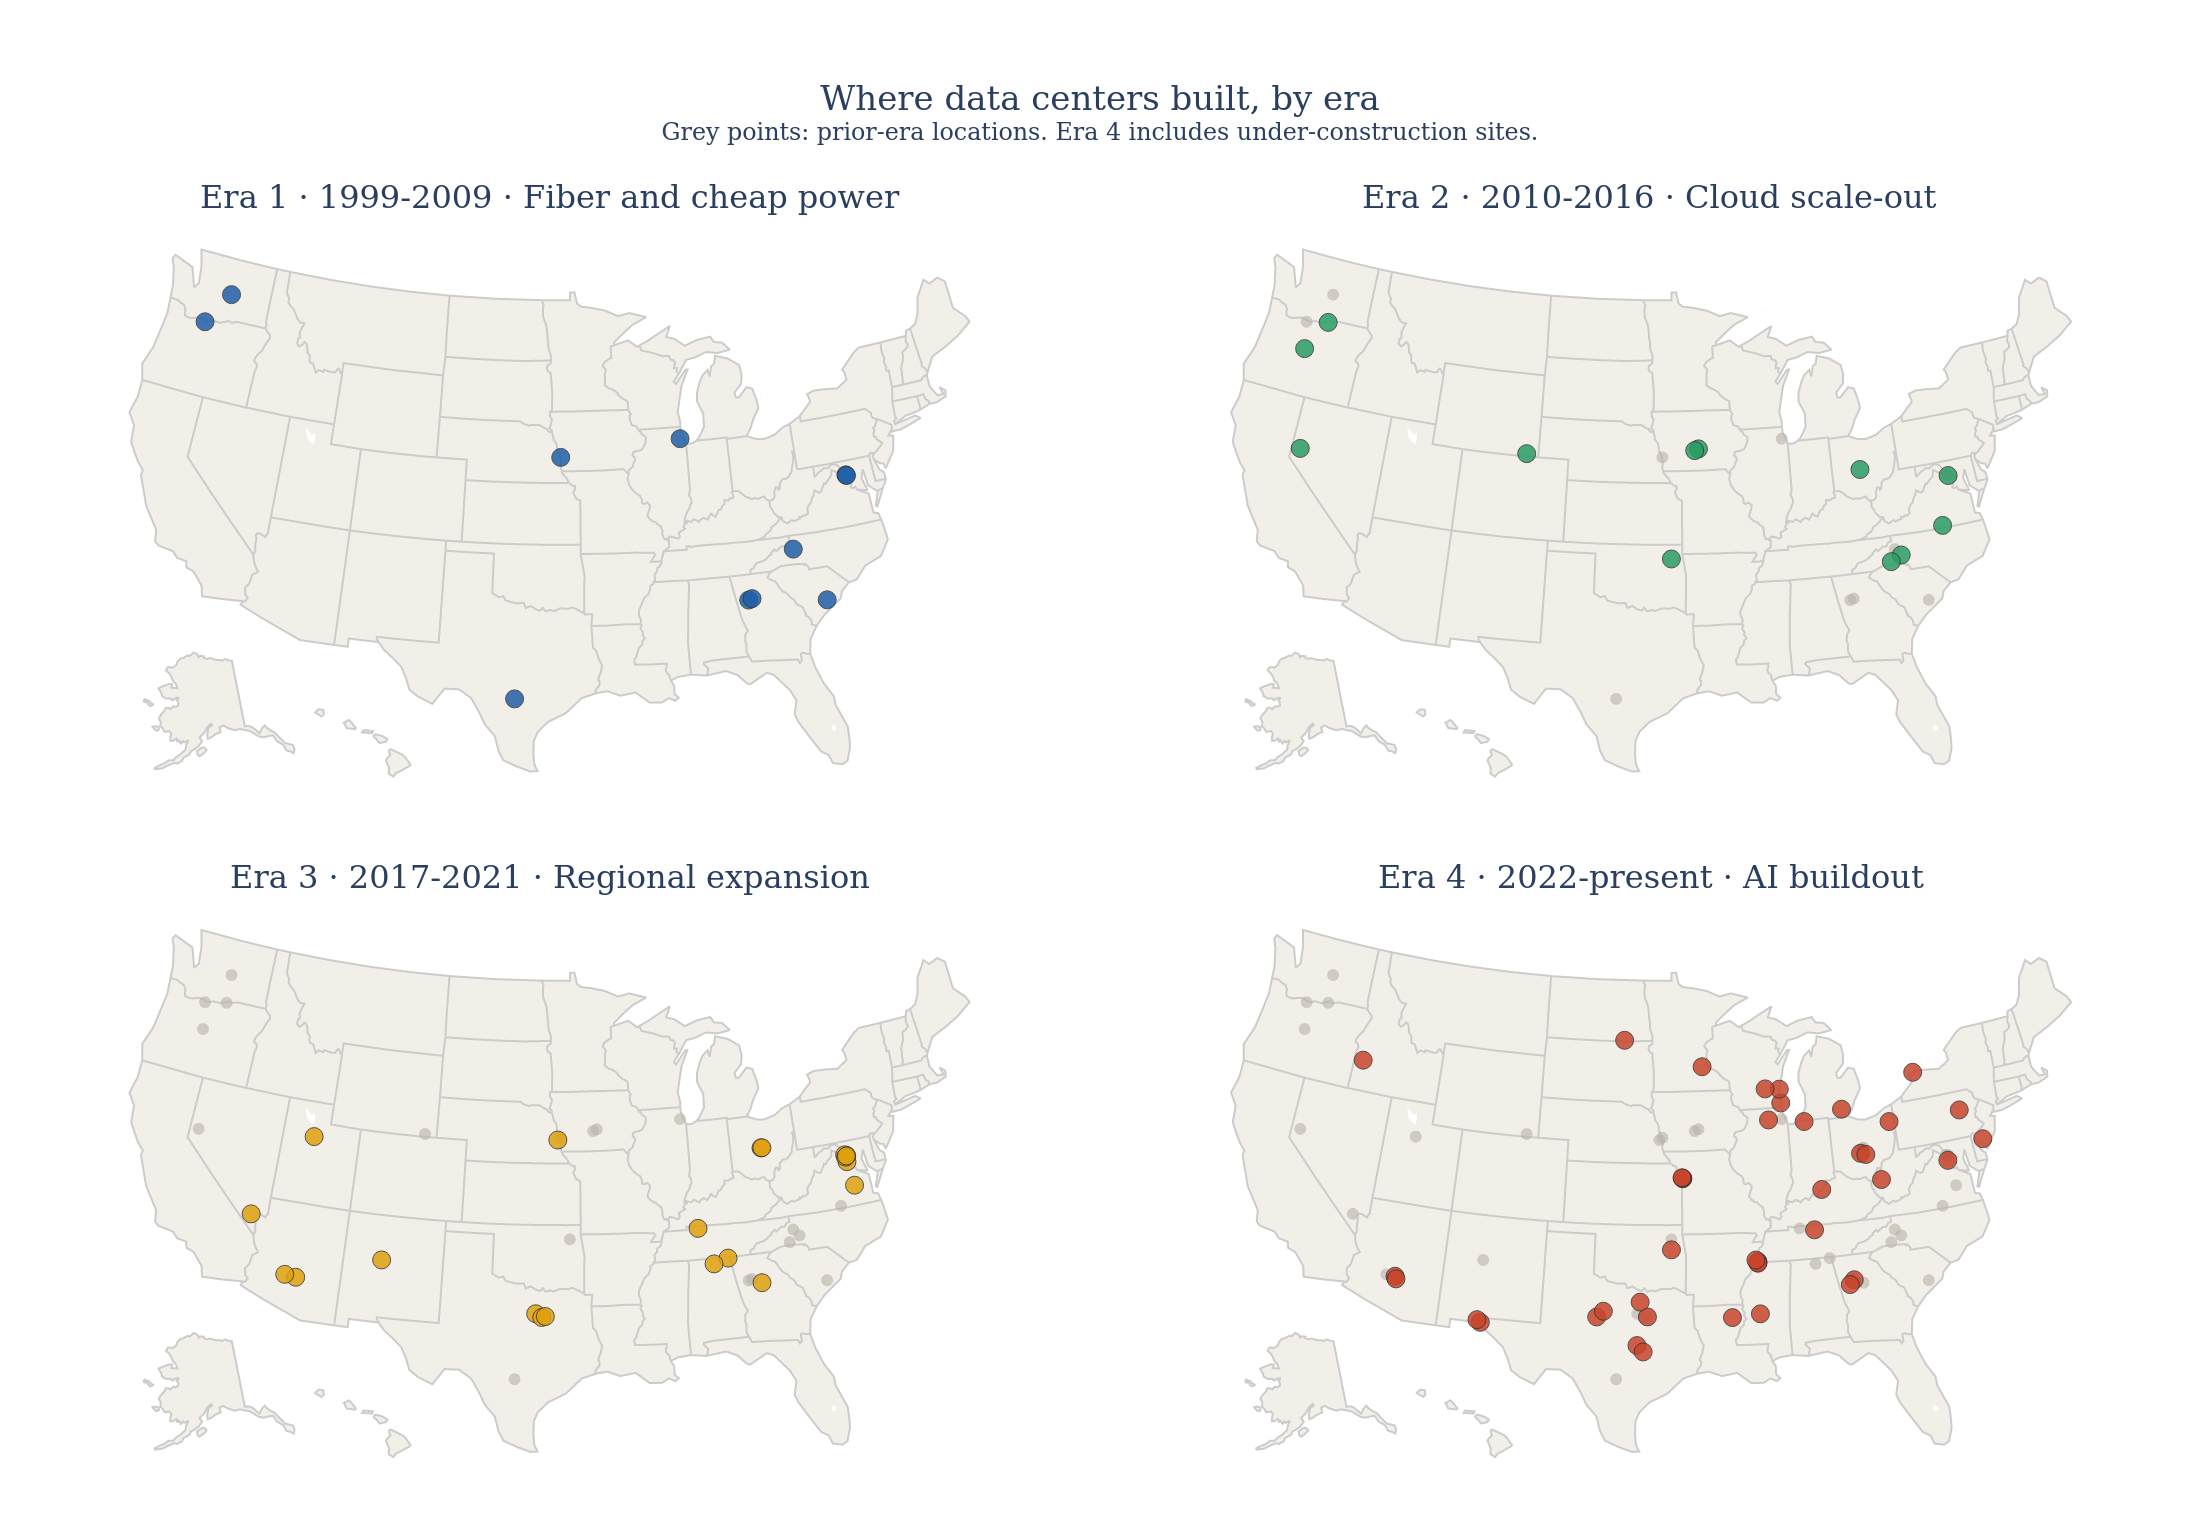
Water does not predict the observed geography nor does it appear often in siting rationales. Power clearly does. In Era 4, speed to power stops being implied and becomes primary. The xAI siting at Memphis was stated as avoiding an eighteen to twenty-four month wait for grid power. The AWS campus at Berwick, Pennsylvania sits beside the Susquehanna nuclear plant.
Power or energy appears in the stated rationale of roughly forty-eight of the sixty-one campuses with statements [7]. Power matters in every era: price, then cleanliness, then availability and speed.
Operator language in the middle era is formulaic enough that the stated rationale under-identifies the real weighting. Land and tax treatment appear almost entirely in host-jurisdiction statements rather than operator ones. The source dataset separates the two so the difference can be seen.
Read from twenty-five years of construction, the priority ordering is speed and abundance of power first, land and connectivity second, and everything else a distant third.
What about water
Roughly two-thirds of US data centers built or in development since 2022 are in regions with high water stress, including southern Arizona, the Colorado River Basin, and Texas [2]. Across the whole existing stock the share is about 40 percent, and it rises to 43 percent for the largest facilities [3]. More than 160 new AI data centers went into high-stress areas in the past three years, a 70 percent increase over the prior three-year period [2].
The map shows what happened next. Where era three pushed into new ground, it went to Arizona, New Mexico, Nevada, and Texas, and collected the lawsuits, the local fights, and the WRI and Ceres findings above. Hot, dry climates leaned evaporative there despite the water it cost. That calculation backfired politically. Era four went to Wisconsin, Indiana, Illinois, Tennessee, Mississippi, and Louisiana.
The stated reasons make the pattern sharper than the map does. Water appears in the siting rationale of five campuses in the dataset: San Antonio, Council Bluffs, Los Lunas, Mesa, and Memphis. Cooling and climate rationales add Prineville, Forest City, Cheyenne, Kuna, and Madison County. Every one is a dry or western site. Across the six era four campuses in Wisconsin, Illinois, and Indiana, water is rarely mentioned [7].
Water became a siting risk without ever becoming a siting criterion. The risk is what comes after the site is chosen: lawsuits, permitting delays, and organized local opposition, the pattern era three’s new-ground expansion collected in Arizona, New Mexico, Nevada, and Texas. At the campus scale in this dataset, water is not a binding national siting constraint. Instead, companies manage that fallout.
The water trade-off
Water use in a data center is a design choice, and that choice trades water against electricity.
Evaporative systems cool by evaporating water, which uses water to save electricity. A large evaporatively cooled facility can use up to five million gallons per day, about 1.8 billion a year [4]. Closed-loop and air-cooled systems spend electricity to save water, and a fully air-cooled facility uses almost none [4]. That trade gets more expensive as ambient temperature rises: above roughly 100°F, air-cooling efficiency drops and fan or chiller loads climb to compensate. Between those extremes are hybrid designs. The same computing load can therefore present a water use profile ranging from a small city’s to nearly none.
There is a second accounting for water that is easy to miss. Fossil and nuclear power plants use water to spin turbines, so every megawatt-hour of grid electricity a data center draws consumes water somewhere upstream. Across the national fleet of data centers, indirect water use from electricity runs about three times direct on-site consumption [6].
The energy profile
At the same scale, energy source is not a binding constraint either. When the grid cannot deliver power on the builder’s schedule, the builder brings generation on site, behind the meter [1]. A data center’s emissions footprint tracks the host grid’s fuel mix [8]. The fastest-growing grid mix remains coal and gas because these resources connect fast.
Clearly clean-energy purchasing is real. The hyperscalers are the largest corporate buyers of renewable power and the only private parties underwriting small modular reactors. But these purchasing decisions follow the siting decisions. In the observed construction record, there is no evidence that grid carbon intensity overrides timely power availability. We Energies is standing up new generation assets for Vantage’s Port Washington campus, paid for by the project. Fuel source is subordinate to obtaining the capacity on schedule.
Scale, and where the water objection is real
Nationally, US data centers consumed about 449 million gallons of water a day, or 163.7 billion gallons a year, as of 2021 [4]. Set against agriculture, thermoelectric power, and municipal supply, that is a small share of national freshwater use, and most of it is the indirect account rather than the cooling towers [6].
Locally it can be serious. The withdrawals are often treated drinking water, concentrated in a few basins that were already short, and the harms in Phoenix, in parts of Georgia, and at The Dalles are documented and real [2][5]. But these are siting failures: facilities placed in stressed basins with evaporative designs and weak water governance. The newest designs are closed-loop or air-cooled precisely because the water backlash made evaporative siting a liability.
Data completeness and disclosure
The dataset behind this analysis covers eighty-six major campuses across the United States, with siting and operational dates sourced one at a time and capacity figures documented where public disclosure exists. Of these, forty-one have defensible capacity figures from utility filings, regulatory dockets, or operator statements. Forty-five remain blank, because the capacity information is either supply-side (renewable PPAs, not load), operator/regulator confidential, available only in aggregate form, announced but undisclosed at publication, or, in one case, a planned full build-out target rather than a disclosed load and excluded on that basis. This distribution of disclosure is itself a finding.
The newest campuses, those built since 2022 for the AI buildout, are the most opaque. Wisconsin and Minnesota are exceptions: Mount Pleasant, Beaver Dam, Port Washington, and Rosemount all have published capacity figures from utility special-rate agreements. Nationwide, Google, Meta, and AWS campuses remain largely silent on load, even when the facilities are operational. That silence reflects a broader pattern: there is no statutory requirement for developers or utilities to disclose their power needs to grid planners until the interconnection process begins, and even then, much of what happens inside that process stays confidential.
The Computer magazine article on power-grid infrastructure (August 2026) names this as a planning barrier: “Two barriers distinguish data centers from existing convention of forecasting large loads: 1) lack of easily accessible power consumption data, treated as trade secrets, and 2) lack of easily accessible development plans, treated as trade secrets.” The same article recommends a solution: “A framework where data center developers have a statutory timeline to publicly disclose their construction or expansion intent and plans.” [11]
Wisconsin’s three era-four campuses provide the proof of concept. When a state requires developers to file special-rate agreements or docket their plans, the power commitment becomes public record. When disclosure is voluntary, it almost never happens.
What the record says
Read as a requirements document, the construction record says two things. Large data centers require power that is abundant and fast to obtain. The Energy Systems Integration Group states it plainly: data center energy use is typically not price-sensitive, and data centers currently prioritize “speed to power,” meaning interconnection and start of operations, over energy savings [9]. They do not require water in any binding sense, because cooling designs let them trade water for electricity at will.
Load visibility
Speed to power is the requirement, and almost nobody sees it coming. The siting record shows what large data centers require. The capacity record shows what they will disclose. Those are not the same thing. No grid planner knows the real load forecast until the facilities announce, and no utility is obliged to share what it knows with ratepayers or regulators. The result is the problem the Computer article describes: planning happens blind to the demand curve that will reshape the grid in the next two to four years [11].
Wisconsin’s three campuses are the exception, transparent because of the special-rate agreements filed with the state. Nationally, absent that kind of filing requirement, the capacity-market data shows the same pattern: abundant short-term supply at high cost, uncertain long-term demand, and infrastructure lag measured in years.
When the grid is slow, builders will bring their own generation, and they are doing it fast. In December 2024, less than 2 gigawatts of data center capacity was planned in a co-located, behind-the-meter configuration. By the end of 2025, roughly 40 such projects totaling about 50 gigawatts had been announced [9]. That is a twenty-five-fold increase in twelve months, and ESIG is explicit that developers pursue co-location as a means to accelerate interconnection, with some new data centers planned as stand-alone or islanded facilities to reduce dependence on the timing of grid build-out [9]. The xAI turbines in Memphis are the visible version of this [1]. The Federal Energy Regulatory Commission and the grid operators now have a vocabulary for it: energy parks, hybrid loads, bring your own generation.
So a host state’s leverage over the footprint is conditional. A state that can connect large load quickly gets to decide what fuel serves it via the grid. A state that cannot loses that option. The load may arrive anyway, with the generation that serves it sitting behind the meter. Self-generation for one’s own use falls outside utility regulation by definition.
Wisconsin’s position follows the same logic. Great Lakes hydrology and closed-loop designs settle the water question here, and everything that remains is the energy question. Speed also keeps the fuel decision on the public side of the meter. The requirement is fast power. The rest is design.
References
- World Resources Institute, “From Energy Use to Air Quality, the Many Ways Data Centers Affect US Communities” (Feb. 2026): https://www.wri.org/insights/us-data-center-growth-impacts
- Bloomberg, “The AI Boom Is Draining Water From the Areas That Need It Most” (2025): https://www.bloomberg.com/graphics/2025-ai-impacts-data-centers-water-data/
- Business Insider, “As drought deepens, big tech has put nearly half of its data centers in water-scarce regions” (June 25, 2025): https://www.businessinsider.com/how-data-centers-are-deepening-the-water-crisis-2025-6
- Miguel Yañez-Barnuevo, “Data Centers and Water Consumption,” Environmental and Energy Study Institute (June 25, 2025): https://www.eesi.org/articles/view/data-centers-and-water-consumption
- Ceres, “Drained by Data: The Cumulative Impact of Data Centers on Regional Water Stress” (2025): https://www.ceres.org/resources/reports/drained-by-data-the-cumulative-impact-of-data-centers-on-regional-water-stress
- Md Abu Bakar Siddik, Arman Shehabi, and Landon Marston, “The environmental footprint of data centers in the United States,” Environmental Research Letters 16, no. 6 (2021): 064017, doi:10.1088/1748-9326/abfba1
- Large data center campus dataset, 86 major US campuses, compiled from utility filings, regulatory dockets, and operator statements (2026). See
resources/DATASET_FINALIZATION.mdandresources/HANDOFF.mdfor methodology and completeness notes. - Arman Shehabi et al., 2024 United States Data Center Energy Usage Report, Lawrence Berkeley National Laboratory (Dec. 2024): https://eta-publications.lbl.gov/sites/default/files/2024-12/lbnl-2024-united-states-data-center-energy-usage-report_1.pdf
- Energy Systems Integration Group, Large Loads Task Force, Transmission Planning with Large Loads: Current Practices and Recommendations (2026)
- U.S. Energy Information Administration, Net Generation by State by Type of Producer (1990-2024): https://www.eia.gov/electricity/data/state/annual_generation_state.xls
- Amir Sajadi, Muhy Eddin Za’ter, Maria Vabson, Kyri Baker, and Bri-Mathias Hodge, “Power Grid Infrastructure for AI Data Centers,” Computer, IEEE Computer Society (2026): 50, doi:10.1109/MC.2026.3687849